Plot exon and domain architectures
factR-plottings.RdPlot exon and domain architectures
Plot exon and domain architectures
# S4 method for factR
plotTranscripts(
  object,
  ...,
  collapse = FALSE,
  rescale_introns = FALSE,
  ncol = 1
)

# S4 method for factR
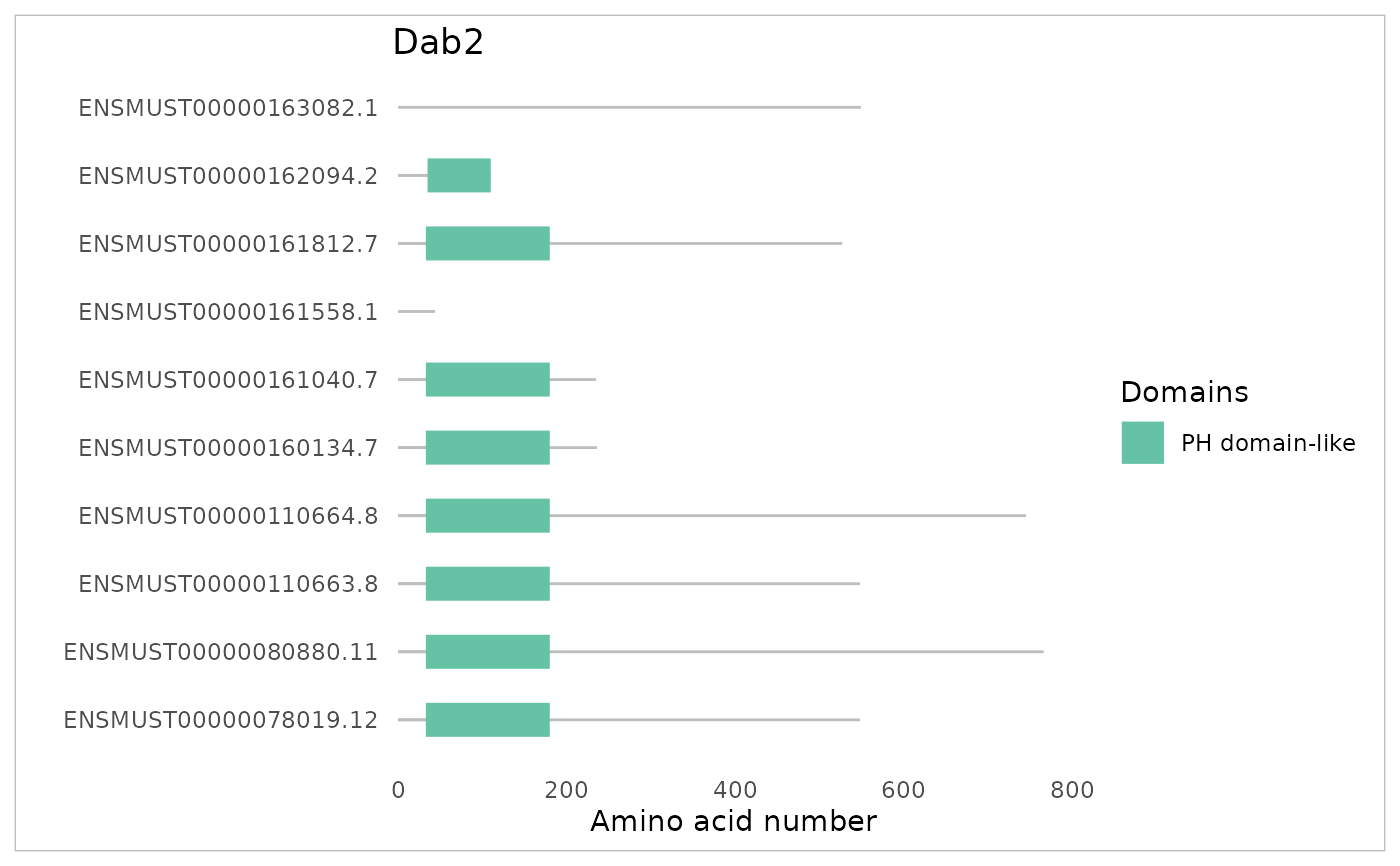
plotDomains(object, ..., ncol = 1)

# S4 method for factR
plot2way(object, x, y, plot_trend = FALSE)
Arguments
- object
factR object class
- ...
One or more features to plot. Can be the following:
gene_id: ID of gene to plot
gene_name: Name of gene to plot
transcript_id: ID of transcript to plot
- collapse
Whether to collapse all transcripts into one (Default: FALSE)
- rescale_introns
Whether to rescale intron sizes. Useful for genes with extremely long introns, this will place emphasis on the exon architectures
- ncol
Dimension of patchworked plot. Applicable if 2 or more features are plotted
- x
Feature to plot. Can be the following:
gene_id: ID of gene to plot
gene_name: Name of gene to plot
transcript_id: ID of transcript to plot
AS_id: ID of alternative splicing event (ASxxxxx)
sample: Column name from sample metadata
- plot_trend
Whether to plot trendline (Default: FALSE)
Value
Interactive plotly plot
ggplot2 plot
Examples
## Load sample factRObject
data(factRsample)
## Plot transcript archtectures:
plotTranscripts(factRsample, "Dab2")
plotTranscripts(factRsample, "Dab2", collapse=TRUE)
plotTranscripts(factRsample, "Dab2", rescale_introns=TRUE)
## To plot protein-coding domains, the CDS segments need to be built first:
factRsample <- buildCDS(factRsample)
factRsample <- getAAsequence(factRsample)
## Plotting of domains:
plotDomains(factRsample, "Dab2")
#> ℹ Set `show_more to TRUE to show more info`
#> Warning: Skipped 6 non-coding transcripts
#> Warning: These transcripts are non-coding: ENSMUST00000159046.1, ENSMUST00000159490.7, ENSMUST00000159552.1, ENSMUST00000162140.1, MSTRG.14564.1, MSTRG.14566.1
